Monte Carlo Experiment for House Pricing Prediction

Model and Data Source

Source: Linear Regression on house pricing on Kaggle posed by Aditya Sharma.

  • $sqfr_{living}$ is square footage of the home;
  • $bedrooms$ is Number of Bedrooms/House;
  • $bathrooms$ is Number of bathrooms/bedrooms;
  • $grade$ is overall grade given to the housing unit, based on King County grading system;
  • $sqft_{above}$ is square footage of house apart from basement;
  • $zipcode$ is zip code;

Here is Description of Data

Load Data

Here is our data:

1
2
3
4
5
6
7
rm(list=ls())

# creating data frame 'hprice'
hprice <- read.csv("kc_house_data.csv")

# Checking data frame
dim(hprice)
## [1] 21613    21
1
class(hprice)
## [1] "data.frame"
1
names(hprice)
##  [1] "id"            "date"          "price"         "bedrooms"     
##  [5] "bathrooms"     "sqft_living"   "sqft_lot"      "floors"       
##  [9] "waterfront"    "view"          "condition"     "grade"        
## [13] "sqft_above"    "sqft_basement" "yr_built"      "yr_renovated" 
## [17] "zipcode"       "lat"           "long"          "sqft_living15"
## [21] "sqft_lot15"
1
2
3
# # obervations
M <- dim(hprice)[1]
M
## [1] 21613
1
2
3
# price in 100K
hprice$price <- hprice$price/1e5
summary(hprice$price)
##    Min. 1st Qu.  Median    Mean 3rd Qu.    Max. 
##   0.750   3.220   4.500   5.401   6.450  77.000
1
2
3
4
## Writing multiple linear regression model without zipcode
model.hp <- lm(price~ sqft_living + bedrooms + bathrooms + grade + sqft_above + zipcode,data = hprice)
sum.hp <- summary(model.hp)
sum.hp
## 
## Call:
## lm(formula = price ~ sqft_living + bedrooms + bathrooms + grade + 
##     sqft_above + zipcode, data = hprice)
## 
## Residuals:
##     Min      1Q  Median      3Q     Max 
## -11.535  -1.307  -0.233   0.941  45.523 
## 
## Coefficients:
##               Estimate Std. Error t value Pr(>|t|)    
## (Intercept) -5.600e+02  3.179e+01 -17.619  < 2e-16 ***
## sqft_living  2.708e-03  4.541e-05  59.637  < 2e-16 ***
## bedrooms    -3.870e-01  2.262e-02 -17.109  < 2e-16 ***
## bathrooms   -2.160e-01  3.437e-02  -6.285 3.34e-10 ***
## grade        1.072e+00  2.364e-02  45.343  < 2e-16 ***
## sqft_above  -6.577e-04  4.422e-05 -14.874  < 2e-16 ***
## zipcode      5.654e-03  3.240e-04  17.453  < 2e-16 ***
## ---
## Signif. codes:  0 '***' 0.001 '**' 0.01 '*' 0.05 '.' 0.1 ' ' 1
## 
## Residual standard error: 2.445 on 21606 degrees of freedom
## Multiple R-squared:  0.5564, Adjusted R-squared:  0.5563 
## F-statistic:  4517 on 6 and 21606 DF,  p-value: < 2.2e-16
1
2
3
4
#==========================
# X data: rmrf, smb, hml
X <- data.matrix(cbind(rep(1, M), hprice$sqft_living, hprice$bedrooms, hprice$bathrooms, hprice$grade, hprice$sqft_above, hprice$zipcode))
is.matrix(X)
## [1] TRUE
1
dim(X)
## [1] 21613     7
1
2
3
# True beta
beta <- sum.hp$coefficients[,1]
is.vector(beta)
## [1] TRUE
1
class(beta)
## [1] "numeric"
1
length(beta)
## [1] 7
1
2
3
4
5
6
#
mu <- 0
sig2e <- var(hprice$price)
# True sigma: std of distribution of error term
sde <- sqrt(sig2e)
sde
## [1] 3.671272

Monte Carlo Simulation

Next, we are running Monte Carlo Simulation.

One Replication Example

1
2
3
set.seed(12345)
Y <- X %*% beta + rnorm(M, mean=0, sd=sde)
class(Y)
## [1] "matrix"
1
is.vector(Y)
## [1] FALSE
1
is.matrix(Y)
## [1] TRUE
1
length(Y)
## [1] 21613
1
2
3
4
5
ff<-lm(Y~X[,-1])
ff2<-lm(Y~X[,c(-1,-3)])

sum <- summary(ff)
sum
## 
## Call:
## lm(formula = Y ~ X[, -1])
## 
## Residuals:
##      Min       1Q   Median       3Q      Max 
## -14.2654  -2.4292  -0.0042   2.4559  14.2330 
## 
## Coefficients:
##               Estimate Std. Error t value Pr(>|t|)    
## (Intercept) -5.265e+02  4.747e+01 -11.090  < 2e-16 ***
## X[, -1]1     2.764e-03  6.782e-05  40.757  < 2e-16 ***
## X[, -1]2    -3.943e-01  3.378e-02 -11.673  < 2e-16 ***
## X[, -1]3    -1.999e-01  5.134e-02  -3.893 9.91e-05 ***
## X[, -1]4     1.046e+00  3.531e-02  29.630  < 2e-16 ***
## X[, -1]5    -7.062e-04  6.604e-05 -10.693  < 2e-16 ***
## X[, -1]6     5.313e-03  4.838e-04  10.981  < 2e-16 ***
## ---
## Signif. codes:  0 '***' 0.001 '**' 0.01 '*' 0.05 '.' 0.1 ' ' 1
## 
## Residual standard error: 3.652 on 21606 degrees of freedom
## Multiple R-squared:  0.3593, Adjusted R-squared:  0.3591 
## F-statistic:  2020 on 6 and 21606 DF,  p-value: < 2.2e-16
1
2
sum2 <- summary(ff2)
sum2
## 
## Call:
## lm(formula = Y ~ X[, c(-1, -3)])
## 
## Residuals:
##      Min       1Q   Median       3Q      Max 
## -16.9540  -2.4375  -0.0134   2.4516  14.5602 
## 
## Coefficients:
##                   Estimate Std. Error t value Pr(>|t|)    
## (Intercept)     -5.549e+02  4.756e+01 -11.668  < 2e-16 ***
## X[, c(-1, -3)]1  2.511e-03  6.446e-05  38.954  < 2e-16 ***
## X[, c(-1, -3)]2 -3.120e-01  5.059e-02  -6.168 7.05e-10 ***
## X[, c(-1, -3)]3  1.120e+00  3.485e-02  32.145  < 2e-16 ***
## X[, c(-1, -3)]4 -6.750e-04  6.619e-05 -10.197  < 2e-16 ***
## X[, c(-1, -3)]5  5.591e-03  4.848e-04  11.534  < 2e-16 ***
## ---
## Signif. codes:  0 '***' 0.001 '**' 0.01 '*' 0.05 '.' 0.1 ' ' 1
## 
## Residual standard error: 3.664 on 21607 degrees of freedom
## Multiple R-squared:  0.3553, Adjusted R-squared:  0.3551 
## F-statistic:  2381 on 5 and 21607 DF,  p-value: < 2.2e-16
1
2
3
4
#==============================
# Confidence interval
cfi<-confint(ff)
cfi
##                     2.5 %        97.5 %
## (Intercept) -6.195125e+02 -4.334107e+02
## X[, -1]1     2.631084e-03  2.896935e-03
## X[, -1]2    -4.605151e-01 -3.280933e-01
## X[, -1]3    -3.005168e-01 -9.925815e-02
## X[, -1]4     9.770620e-01  1.115488e+00
## X[, -1]5    -8.356179e-04 -5.767387e-04
## X[, -1]6     4.364900e-03  6.261629e-03
1
class(cfi)
## [1] "matrix"
1
dim(cfi)
## [1] 7 2
1
2
3
4
5
6
# If true beta is in confidence interval of estimated beta
flag.beta <- logical(length(beta))
for (k in 1:length(beta)){
flag.beta[k] <- cfi[k,1]<=beta[k]&&cfi[k,2]>=beta[k]
}
flag.beta
## [1] TRUE TRUE TRUE TRUE TRUE TRUE TRUE
1
class(flag.beta)
## [1] "logical"
1
length(flag.beta)
## [1] 7
1
2
3
4
#==============================
# estimated error variance
err.var <- deviance(ff)/df.residual(ff)
err.var
## [1] 13.33942
1
2
3
#==============================
# \hat{\beta}
ff$coefficients
##   (Intercept)      X[, -1]1      X[, -1]2      X[, -1]3      X[, -1]4 
## -5.264616e+02  2.764009e-03 -3.943042e-01 -1.998875e-01  1.046275e+00 
##      X[, -1]5      X[, -1]6 
## -7.061783e-04  5.313264e-03
1
2
3
4
5
6
7
8
9
10
11
12
13
#==============================
# T-Test: Null Hypothesis: betahat = beta
# Significant level of t-test
alp <- 0.05
# T statistics = (betahat-beta)/s.e.
t.stat <- (sum$coefficients[,1]-beta)/sum$coefficients[,2]
# t_{1-\alpha/2, n-k}
thr <- qt(1-alp/2, df = df.residual(ff))
# whether reject null hypothesis: False - not reject; True - reject (Type I)
# We should not reject the null hypothesis of beta = betahat
# But if we reject it (<alp), we are making Type I error, right?
flag.type1 <- t.stat>thr | t.stat < - thr
flag.type1
## (Intercept)    X[, -1]1    X[, -1]2    X[, -1]3    X[, -1]4    X[, -1]5 
##       FALSE       FALSE       FALSE       FALSE       FALSE       FALSE 
##    X[, -1]6 
##       FALSE
1
class(flag.type1)
## [1] "logical"
1
length(flag.type1)
## [1] 7

Running Monte Carlo Simulation

1
2
3
4
5
6
7
8
9
10
11
12
13
14
15
16
17
18
19
20
21
22
23
24
25
26
27
28
29
30
31
32
33
34
35
36
37
38
39
40
41
42
43
44
45
46
47
48
49
50
51
52
53
54
55
56
57
58
59
60
61
62
63
64
65
66
67
68
69
70
71
72
73
74
75
76
77
78
79
80
81
82
83
84
# Vector of N (Replication number)
vecN <- c(500)
#vecN <- c(10,50,100,500,1e3,5e3,1e4,5e4)
# level of t-test
alpha <- 0.05
#
mat.betahat <- matrix(0, nrow = length(vecN), ncol = length(beta))
mat.betahat2 <- matrix(0, nrow = length(vecN), ncol = length(beta)-1)
mat.vebh <- matrix(0, nrow = length(vecN), ncol = length(beta))
vec.err.varh <- numeric(length(vecN))
vec.err.varh2 <- numeric(length(vecN))
prob.flag.beta <- matrix(0, nrow = length(vecN), ncol = length(beta))
prob.flag.type1 <- matrix(0, nrow = length(vecN), ncol = length(beta))
prob.flag.type1.2 <- matrix(0, nrow = length(vecN), ncol = length(beta)-1)
mat.t.stathat <- matrix(0, nrow = length(vecN), ncol = length(beta))
for (j in 1:length(vecN)){
N <- vecN[j]
mat.beta <- matrix(0,nrow = N, ncol = length(beta))
mat.beta2 <- matrix(0,nrow = N, ncol = length(beta)-1)
vec.flag.beta <- logical(N*length(beta))
vec.err.var <- numeric(N)
vec.err.var2 <- numeric(N)
vec.flag.type1 <- logical(N*length(beta))
vec.flag.type1.2 <- logical(N*(length(beta)-1))
mat.t.stat <- matrix(0,nrow = N, ncol = length(beta))
mat.t.stat2 <- matrix(0,nrow = N, ncol = length(beta)-1)
#
for (i in 1:N) {
set.seed(27+6*i)
Y <- X %*% beta + rnorm(M, mean=0, sd=sde)
# Full Linear Regression
ff<-lm(Y~X[,-1])
# Omitt SMB variable
ff2<-lm(Y~X[,c(-1,-3)])
# Confidence interval
cfi<-confint(ff)
# If true beta is in confidence interval of estimated beta
for (k in 1:length(beta)){
vec.flag.beta[(i-1)*length(beta)+k] <- cfi[k,1]<=beta[k]&&cfi[k,2]>=beta[k]
}
# estimated error variance
vec.err.var[i] <- deviance(ff)/df.residual(ff)
vec.err.var2[i] <- deviance(ff2)/df.residual(ff2)
# \hat{\beta}
mat.beta[i,] <- as.matrix(ff$coefficients)
mat.beta2[i,] <- as.matrix(ff2$coefficients)
# T statistics = (betahat-beta)/s.e.
sum <- summary(ff)
sum2 <- summary(ff2)
mat.t.stat[i,] <- (sum$coefficients[,1]-beta)/sum$coefficients[,2]
mat.t.stat2[i,] <- (sum2$coefficients[,1]-beta[c(1,2,4)])/sum2$coefficients[,2]
# t_{1-\alpha/2, n-k}
threshold <- qt(1-alpha/2, df = df.residual(ff))
# whether reject null hypothesis: False - not reject; True - reject (Type I)
# We should not reject the null hypothesis of beta = betahat
# But if we reject it (<alp), we are making Type I error, right?
for (k in 1:length(beta)){
vec.flag.type1[(i-1)*length(beta)+k] <- mat.t.stat[i,k] > threshold | mat.t.stat[i,k] < -threshold
}
for (k in 1:(length(beta)-1)){
vec.flag.type1.2[(i-1)*(length(beta)-1)+k] <- mat.t.stat2[i,k] > threshold | mat.t.stat2[i,k] < -threshold
}
}

# \hat{\beta}
mat.betahat[j,] <- colMeans(mat.beta)
mat.betahat2[j,] <- colMeans(mat.beta2)
# \variance of betahat
mat.vebh[j,] <- apply(mat.beta, 2, var)
# error variance
vec.err.varh[j] <- mean(vec.err.var)
vec.err.varh2[j] <- mean(vec.err.var2)
# Probability of true beta is in confidence interval of estimated beta
mat.flag.beta <- matrix(vec.flag.beta, ncol = length(beta), byrow = T)
prob.flag.beta[j,] <- colSums(mat.flag.beta)/N
# Prob of Type I
mat.flag.type1 <- matrix(vec.flag.type1, ncol = length(beta), byrow = T)
prob.flag.type1[j,] <- colSums(mat.flag.type1)/N
# Prob of Type I
mat.flag.type1.2 <- matrix(vec.flag.type1.2, ncol = length(beta)-1, byrow = T)
prob.flag.type1.2[j,] <- colSums(mat.flag.type1.2)/N
#
mat.t.stathat[j,] <- colMeans(mat.t.stat)
}

Plot of N = 500

1
2
3
4
5
6
7
8
9
10
11
12
13
14
15
16
17
18
19
20
21
22
23
24
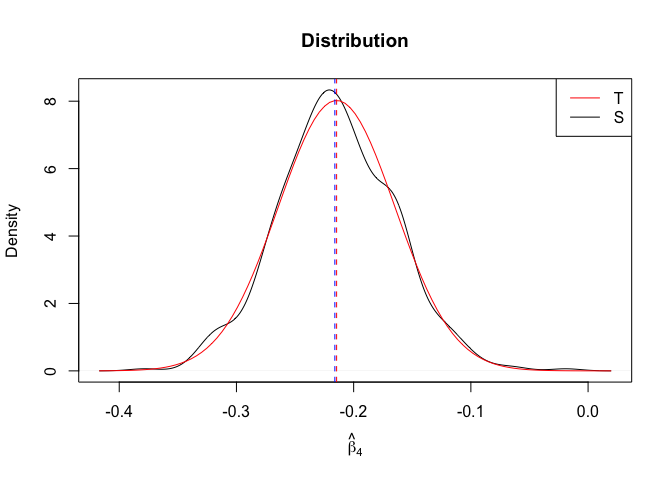
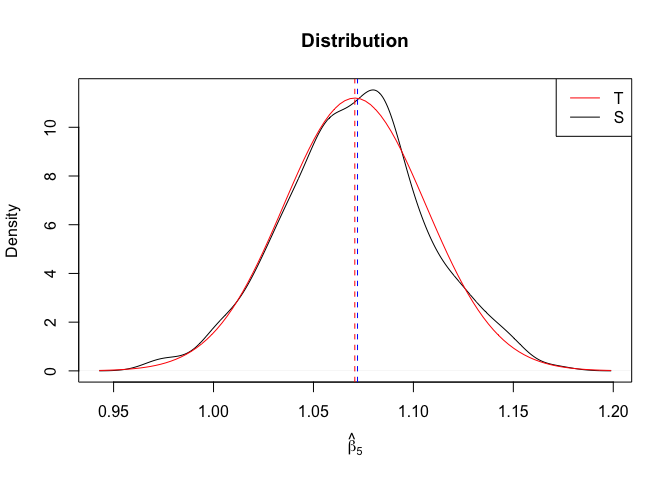
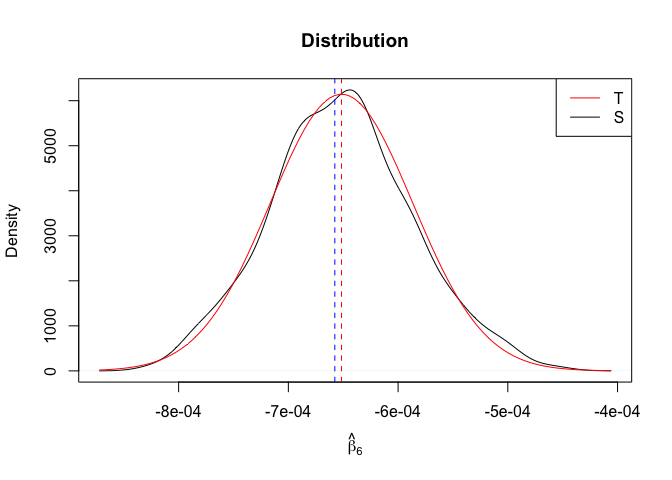
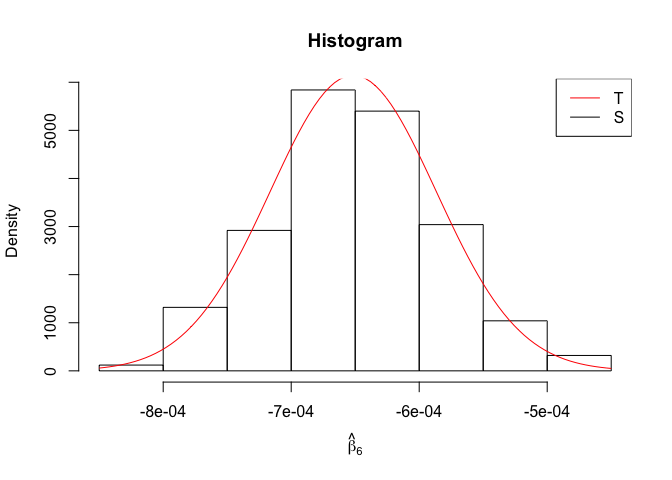
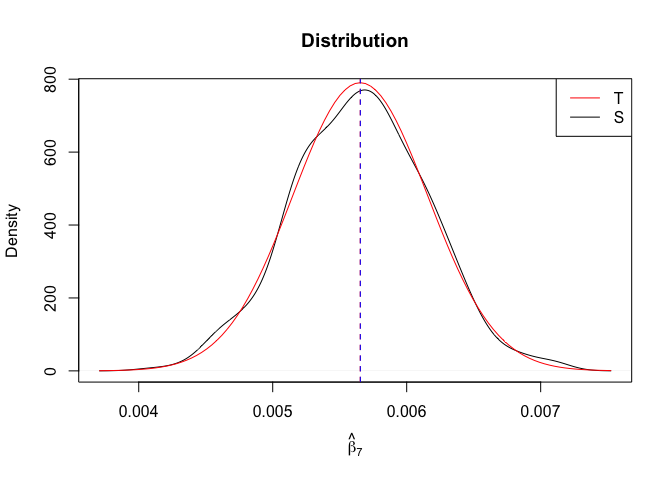
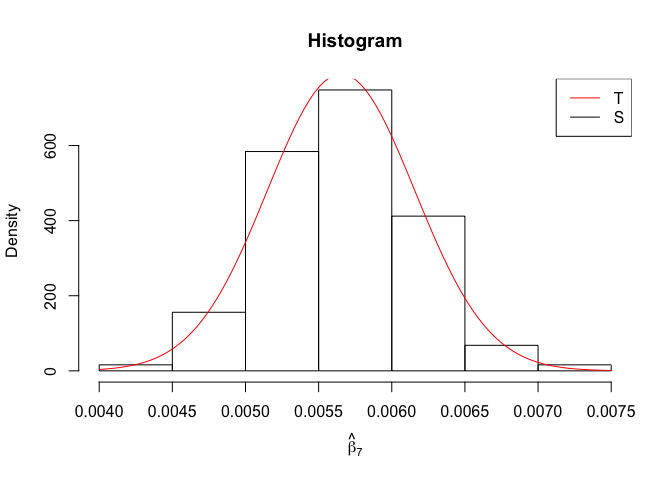
# In Distribution pic, bulue line is true beta, red line is betahat
foo = expression(hat(beta)[1], hat(beta)[2],hat(beta)[3],hat(beta)[4],hat(beta)[5],hat(beta)[6],hat(beta)[7])
for (i in 1:length(beta)){
# mypath <- file.path(getwd(),"Figure",paste("density_beta_",i, ".jpeg", sep = ""))
# jpeg(mypath, height = 8, width = 8, units = 'in', res = 300)
# beta_{i}
plot(density(mat.beta[,i]), xlab = foo[[i]], main = "Distribution")
curve(dnorm(x, mat.betahat[length(vecN),i], sqrt(mat.vebh[length(vecN),i])), col="red", add=TRUE)
abline(v=mat.betahat[length(vecN),i], col = "red", lty = 2)
abline(v=beta[i], col = "blue", lty = 2)
# "T" for "True", "S" for "Simulated"
legend("topright", legend=c("T", "S"),
lty=1, col=c("red", "black"))
# dev.off()
##
# mypath <- file.path(getwd(),"Figure",paste("hist_beta_",i, ".jpeg", sep = ""))
# jpeg(mypath, height = 8, width = 8, units = 'in', res = 300)
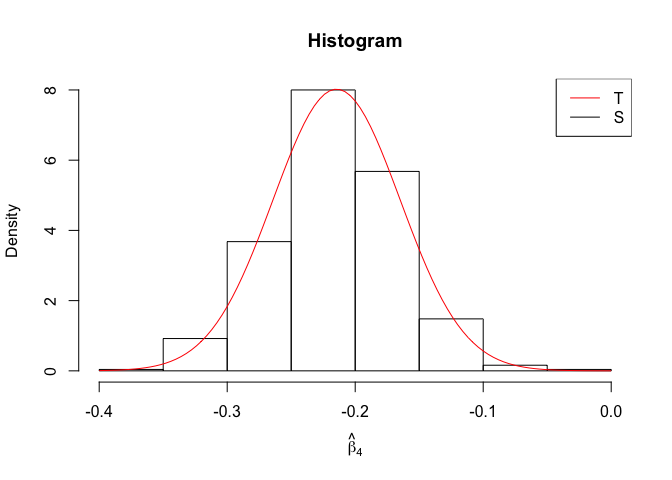
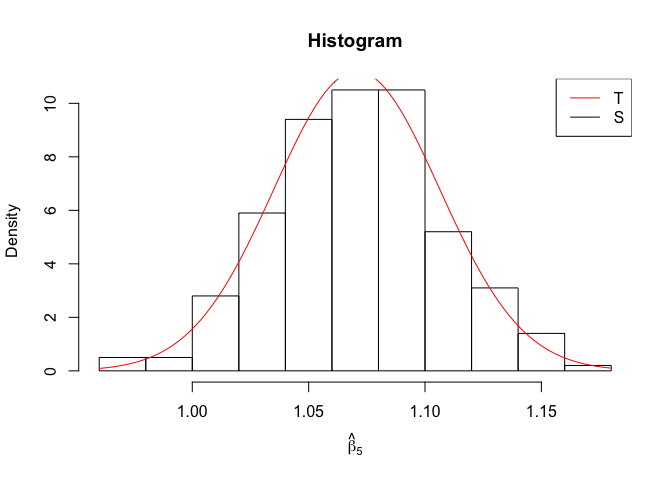
hist(mat.beta[,i], prob=TRUE, xlab = foo[[i]], main = "Histogram")
curve(dnorm(x, mat.betahat[length(vecN),i], sd=sqrt(mat.vebh[length(vecN),i])), col="red", add=TRUE)
# "T" for "True", "S" for "Simulated"
legend("topright", legend=c("T", "S"),
lty=1, col=c("red", "black"))
# dev.off()
}

1
2
3
4
5
6
7
8
9
10
11
12
13
14
15
16
17
18
19
20
21
22
23
24
25
26
27
28
29
30
31
32
33
34
35
36
rm(list=ls())
# creating data frame 'hprice'
hprice <- read.csv("kc_house_data.csv")
# # obervations
M <- dim(hprice)[1]
# price in 100K
hprice$price <- hprice$price/1e5

## Writing multiple linear regression model without zipcode
model.hp <- lm(price~ sqft_living + bedrooms + bathrooms + grade + sqft_above + zipcode,data = hprice)
sum.hp <- summary(model.hp)
#==========================
# X data: rmrf, smb, hml
X <- data.matrix(cbind(rep(1, M), hprice$sqft_living, hprice$bedrooms, hprice$bathrooms, hprice$grade, hprice$sqft_above, hprice$zipcode))
# True beta
beta <- sum.hp$coefficients[,1]
#
mu <- 0
sig2e <- var(hprice$price)
# True sigma: std of distribution of error term
sde <- sqrt(sig2e)
#==================
load(file = "mchp.RData")
attach(object)
#===========================
# Significance level of t-test
alpha <- 0.05
mat.betahat <- object[,2:8]
mat.betahat2 <- object[9:14]
mat.vebh <- object[15:21]
vec.err.varh <- object$err.varh
vec.err.varh2 <- object$err.varh2
prob.flag.beta <- object[24:30]
prob.flag.type1 <- object[31:37]
prob.flag.type1.2 <- object[38:43]
mat.t.stathat <- object[44:50]

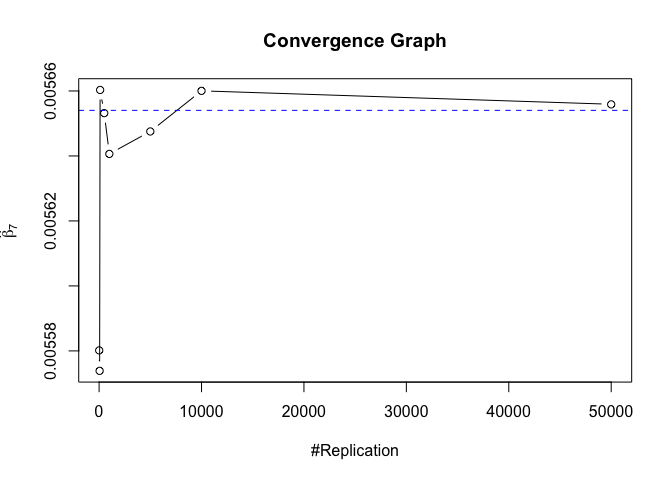
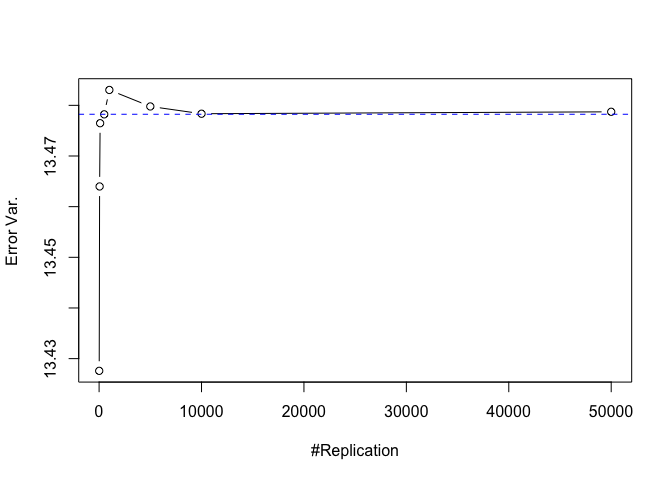
Finding (i)

  1. The O.L.S. estimators of the unknown coefficients and error variance are unbiased
1
2
3
4
5
6
7
8
foo = expression(hat(beta)[1], hat(beta)[2],hat(beta)[3],hat(beta)[4],hat(beta)[5],hat(beta)[6],hat(beta)[7])
for (i in 1:length(beta)){
# mypath <- file.path(getwd(),"Figure",paste("i_OLS_betahat_",i, ".jpeg", sep = ""))
# jpeg(mypath, height = 8, width = 8, units = 'in', res = 300)
plot(vecN, mat.betahat[,i], type="b", xlab = "#Replication", ylab = foo[[i]], main="Convergence Graph")
abline(h=beta[i], col = "blue", lty = 2)
# dev.off()
}

1
2
3
4
5
6
# Error Variance
# Unbised estimater of sigma^2
# mypath <- file.path(getwd(),"Figure","i_var_err.jpeg")
# jpeg(mypath, height = 8, width = 8, units = 'in', res = 300)
plot(vecN, vec.err.varh, type="b", xlab = "#Replication", ylab = "Error Var.")
abline(h=sig2e, col = "blue", lty = 2)

1
# dev.off()

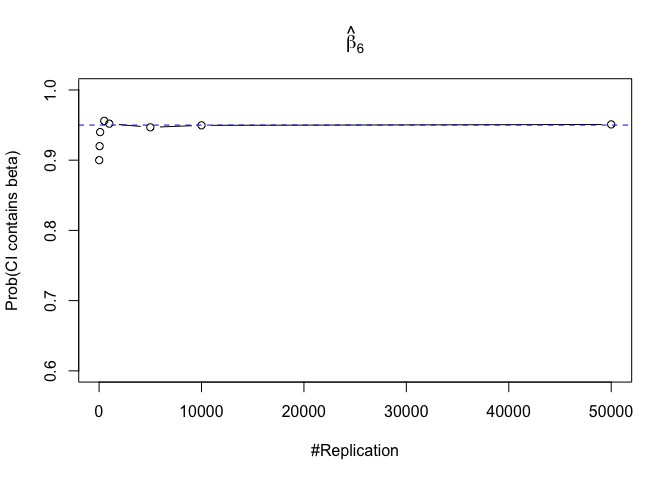
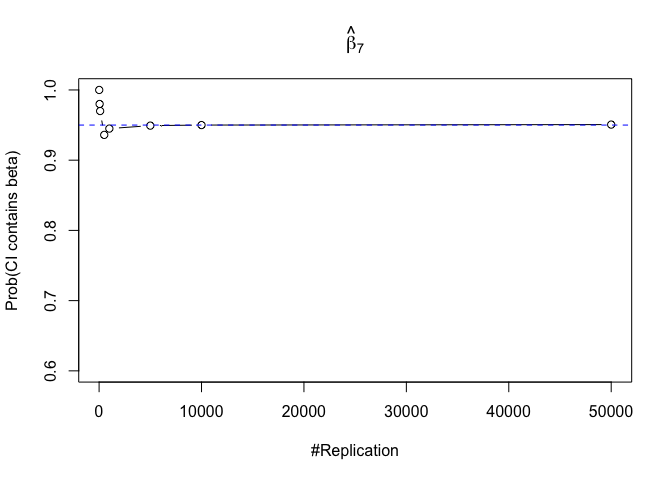
Finding (ii)

  1. The “correct” meaning of a 100(1‐α)% confidence interval of an unknown coefficient
1
2
3
4
5
6
7
for (i in 1:length(beta)){
# mypath <- file.path(getwd(),"Figure",paste("ii_prob_beta_",i, ".jpeg", sep = ""))
# jpeg(mypath, height = 8, width = 8, units = 'in', res = 300)
plot(vecN, prob.flag.beta[,i], type="b", xlab = "#Replication", ylab = "Prob(CI contains beta)", main=foo[[i]], ylim = c(0.6,1))
abline(h=0.95, col = "blue", lty = 2)
# dev.off()
}

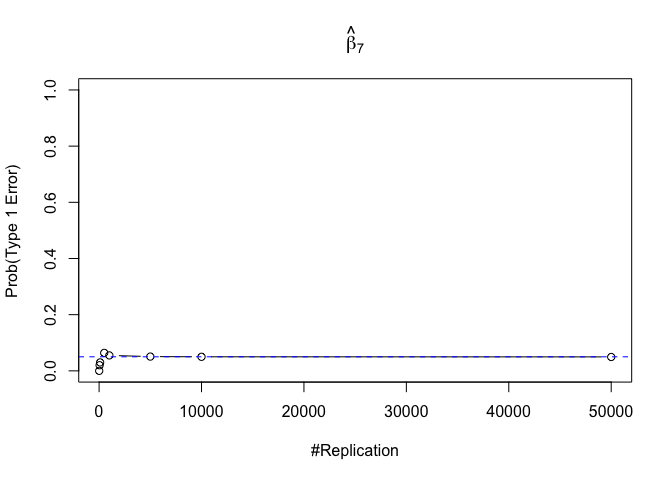
Finding (iii)

  1. The significance level of the t test for testing a linear hypothesis concerning one or more coefficients is the probability of committing a Type I error
1
2
3
4
5
6
7
for (i in 1:length(beta)){
# mypath <- file.path(getwd(),"Figure",paste("iii_prob_type1err_",i, ".jpeg", sep = ""))
# jpeg(mypath, height = 8, width = 8, units = 'in', res = 300)
plot(vecN, prob.flag.type1[,i], type="b", xlab = "#Replication", ylab = "Prob(Type 1 Error)", main=foo[[i]], ylim = c(0,1))
abline(h=0.05, col = "blue", lty = 2)
# dev.off()
}

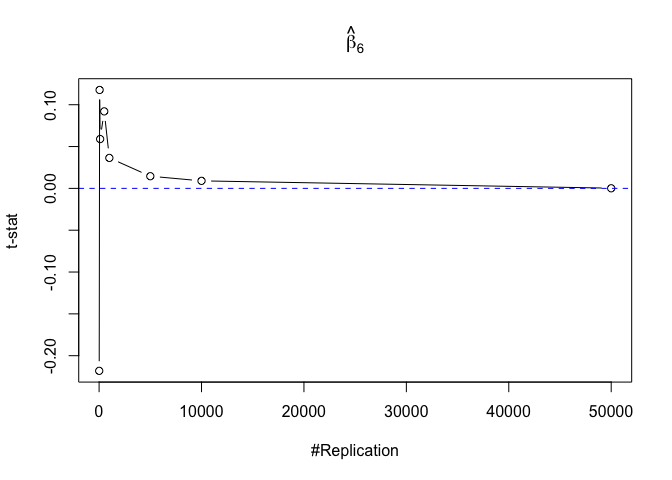
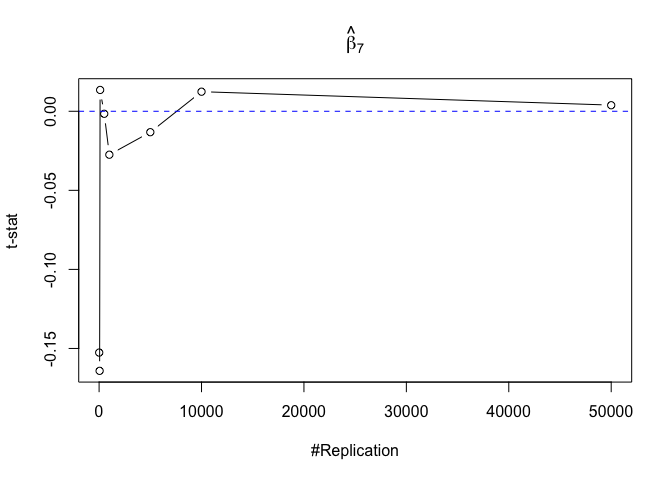
Finding (iv)

  1. The t test is unbiased
1
2
3
4
5
6
7
for (i in 1:length(beta)){
# mypath <- file.path(getwd(),"Figure",paste("iv_tstat_",i, ".jpeg", sep = ""))
# jpeg(mypath, height = 8, width = 8, units = 'in', res = 300)
plot(vecN, mat.t.stathat[,i], type="b", xlab = "#Replication", ylab = "t-stat", main=foo[[i]])
abline(h=0, col = "blue", lty = 2)
# dev.off()
}

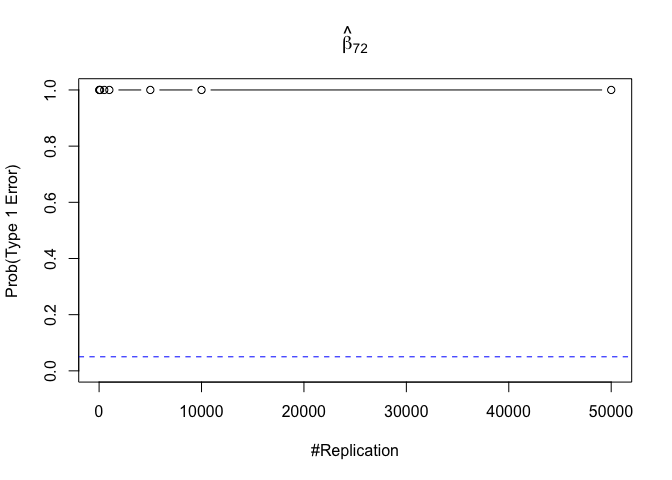
Finding (v)

  1. The result in Part iii) no longer holds if some relevant explanatory variables have been omitted from the model
1
2
3
4
5
6
7
8
foo3 = expression(hat(beta)[12], hat(beta)[22],hat(beta)[42], hat(beta)[52], hat(beta)[62], hat(beta)[72])
for (i in 1:(length(beta)-1)){
# mypath <- file.path(getwd(),"Figure",paste("v_prob_type1err_",i, ".jpeg", sep = ""))
# jpeg(mypath, height = 8, width = 8, units = 'in', res = 300)
plot(vecN, prob.flag.type1.2[,i], type="b", xlab = "#Replication", ylab = "Prob(Type 1 Error)", main=foo3[[i]], ylim = c(0,1))
abline(h=0.05, col = "blue", lty = 2)
# dev.off()
}

Finding (vi)

  1. The estimator of say, the coefficient of X2, is no longer unbiased if the decision of whether to include X1 in the model is dependent on the outcome of a t test. Based on your findings, discuss the wider implications of “model selection” for statistical modeling and the lessons to be learnt for practitioners.
1
2
3
4
5
6
7
8
nbv = c(1,2,4)
for (i in 1:(length(beta)-1)){
# mypath <- file.path(getwd(),"Figure",paste("vi_batahat_",i, ".jpeg", sep = ""))
# jpeg(mypath, height = 8, width = 8, units = 'in', res = 300)
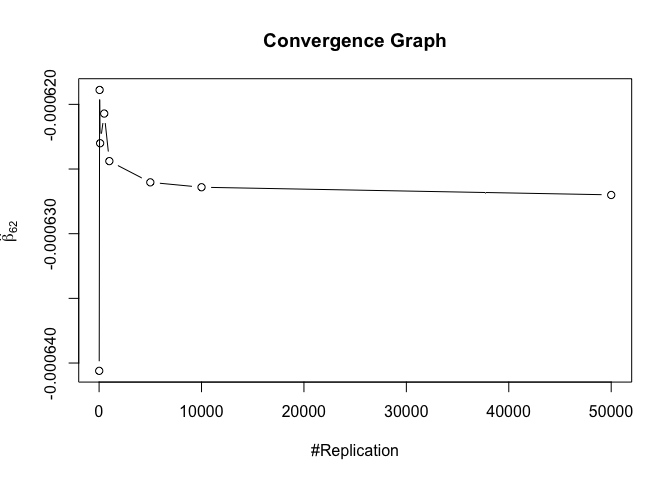
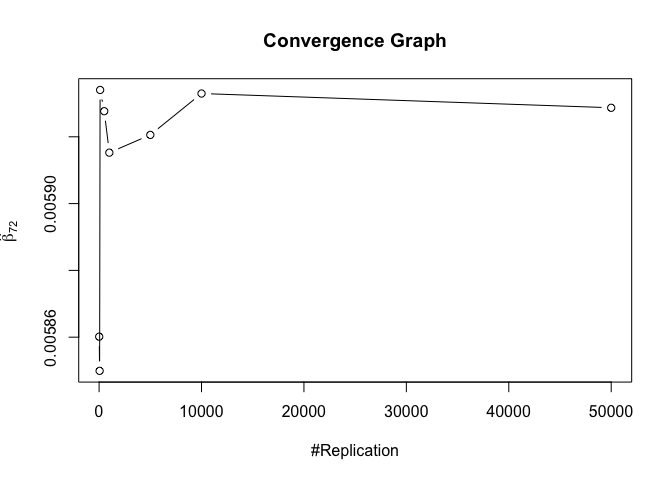
plot(vecN, mat.betahat2[,i], type="b", xlab = "#Replication", ylab = foo3[[i]], main="Convergence Graph")
abline(h=beta[nbv[i]], col = "blue", lty = 2)
# dev.off()
}

1
2
3
4
5
6
7
# Error Variance
# Unbised estimater of sigma^2
# mypath <- file.path(getwd(),"Figure","vi_var_err.jpeg")
# jpeg(mypath, height = 8, width = 8, units = 'in', res = 300)
# bty for Box Style
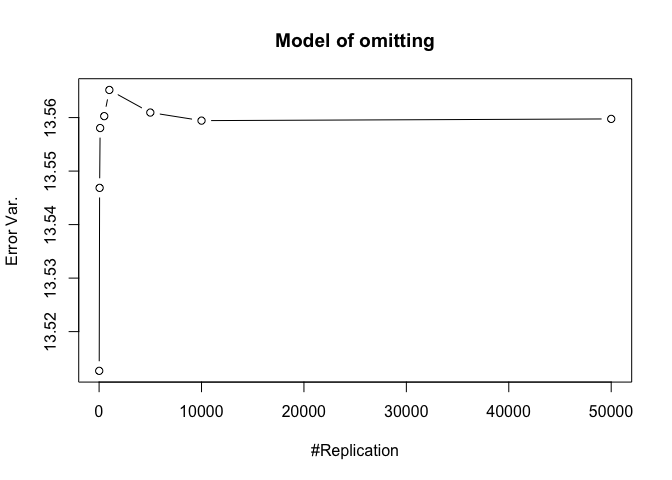
plot(vecN, vec.err.varh2, type="b", xlab = "#Replication", ylab = "Error Var.", main = "Model of omitting")
abline(h=sig2e, col = "blue", lty = 2)

1
# dev.off()
-------------End of postThanks for your time-------------
BaoDuGe_飽蠹閣 wechat
Enjoy it? Subscribe to my blog by scanning my public wechat account